简体中文
繁體中文
English
Pусский
日本語
ภาษาไทย
Tiếng Việt
Bahasa Indonesia
Español
हिन्दी
Filippiiniläinen
Français
Deutsch
Português
Türkçe
한국어
العربية
Silver Price Analysis: XAG/USD grinds higher on the way to $24.00
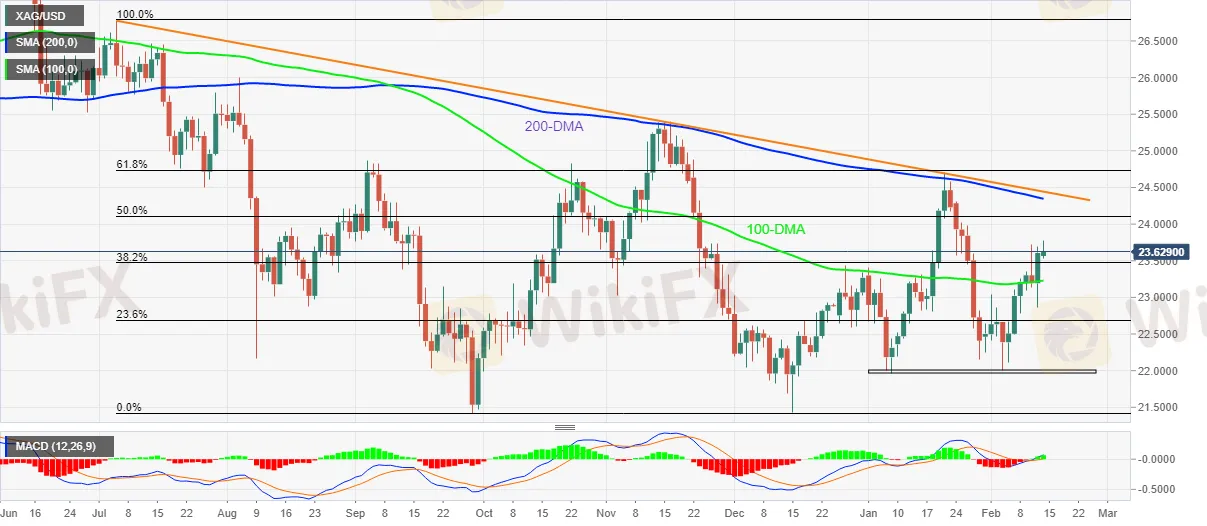
Abstract:Silver (XAG/USD) pares intraday gains around $23.65, up 0.10% on a day during the mid-Asian session on Monday.

Silver retreats after refreshing 13-day high, keeps bounce off 100-DMA.
Bullish MACD signals also underpin run-up towards 200-DMA.
Seven-month-old resistance line acts as the key hurdle.
The bright metal refreshed multi-day low during the early Asian session before easing from $23.78.
The pullback moves, however, remain above the 100-DMA amid bullish MACD signals, which in turn keeps the buyers hopeful until the quote drops below the stated SMA support, around $23.20 by the press time.
Also acting as downside filters are 23.6% Fibonacci retracement (Fibo.) of July-September declines and a five-week-long horizontal support zone, respectively around $22.70 and $22.00.
Alternatively, XAG/USD upside eyes $24.00 threshold as the immediate resistance ahead of confronting the 50% Fibo. near $24.10.
It should be noted, though, that the quotes upside past $24.10 will be challenged by the 200-DMA and a descending trend line from July, near $24.35 and $24.45 in that order.
Overall, silver prices are likely to advance further but the upside is seen as limited.
Silver: Daily chart

Disclaimer:
The views in this article only represent the author's personal views, and do not constitute investment advice on this platform. This platform does not guarantee the accuracy, completeness and timeliness of the information in the article, and will not be liable for any loss caused by the use of or reliance on the information in the article.
Read more

WikiEXPO 2025 is set to embark on a new global tour
WikiEXPO 2025 is set to embark on a new global tour First station - Hong Kong! Are you ready?

Will the Euro and US Dollar Reach Parity in 2025?
Euro-dollar parity sparks debate again as 2025 approaches, with multiple factors shaping the exchange rate outlook.

US Dollar Surge Dominates Forex Market
The global forex market continues to show volatility, with the U.S. dollar fluctuating last week but overall maintaining a strong upward trend. How long can this momentum last?

Oil Prices Soar for 5 Days: How Long Will It Last?
Last week, the global oil market saw a strong performance, with Brent crude and WTI crude prices rising by 2.4% and around 5% respectively. Oil prices have now posted five consecutive days of gains. But how long can this rally last?
WikiFX Broker
Latest News
How Long Can the Dollar Remain Strong?
Forex Price Trend Prediction! | Come be a New Year Price Winner!
HFM NY Special Offer!
How a Promised RM1.4 Million Return Turned into a Costly Scam
First Unfair Trading Case Reported Under South Korea’s Virtual Asset User Protection Act
Cinkciarz.pl Under Fire: Frozen Accounts, Missing Funds
“Predict and Win” Big Rewards! Join the Contest Now
South Korean President Yoon Suk Yeol's Arrest Shakes Markets
Titanium Capital LLC Ponzi Scheme: Henry Abdo Admits Fraud, Impacting Over 200 Investors
South Korea's Crypto Regulation Updates for 2025
Currency Calculator


